Markov Chain Model Of FSM
Before the actual decomposition takes place, we need to convert the given STG to
an undirected weighted graph. The weight on the edges of such a graph corresponds
to the relative probability of transitions between the two states that are connected
by that edge. This probability distribution is obtained by modeling FSMs as Markov
chains.
Power Dissipation Model
For digital circuits, power dissipation at a node is proportional to the average
switching activity at that node. Switching activity is measured as the number of times
the node switches from one logic level to another in a given period of time. If the
switching probability at the input nodes is known, we can calculate the transition
probability of each edge of the STG. According to the transition probability values,
we can then determine a decomposition that tries to minimize the switching activity
at all nodes. Here, a model of power dissipation for CMOS circuits is introduced. A
technique for obtaining the total transition probability from a given input probability
distribution is explained next .
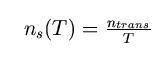
The average switching activity at the output of a gate i in a time period T is
dened as the average number of signal transitions:
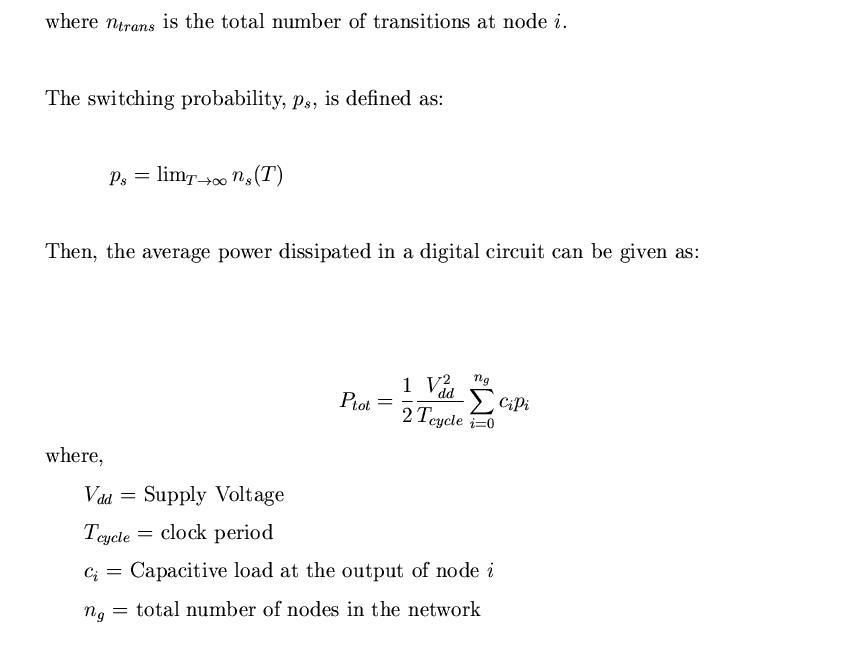
Power consumption at the gate level can be reduced by minimizing
the effect of any of the variables in the above equation. But as a designer, supply voltage is to be
considered as a constant. Choosing a clock period suitable for the power dissipation
may add extra constraints on the other aspects of the design. So, the only thing that
can be optimized is the product of capacitance and switching activity for all nodes.
FSM can be modeled as a Markov chain for calculating transition probabilities.
Markov Chain Model Of FSM
For computing the transition probabilities for a given STG, we need to know the
probability distribution for the input nodes. The input probability can be obtained
by simulating finite state machines at a higher level of abstraction in the context of
its environment or by the direct knowledge from the designer. Transition probability
for each edge in the STG can then be determined by modeling the STG as a Markov
chain. Markov chain is a stochastic process whose dynamic behavior is such that the
probabilistic distribution for it's future development depends only on the present
state and not on how the process arrived in that state.
The Markov chain model for a STG can be described by a directed graph with
weighted edges.
The conditional probability distribution can be easily obtained from the input
probability distribution and observing the input configurations for which a particular
transition occurs.This conditional probability when taken into account along with the
steady state probability of the present state gives the correct transition probability
called the total transition probability.
The steady state probability for state can be defined as the probability
that the FSM will remain in the state . These probability values are not time
dependent, i.e. as the time increases, the probability values will converge to constant
real numbers.
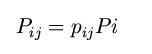
Let P be the conditional transition probability matrix whose entries are the
conditional transition probabilities andv be the steady state probability vector whose
components are the state probabilities. Then we can compute the steady state
probabilities by solving the following system of equations,
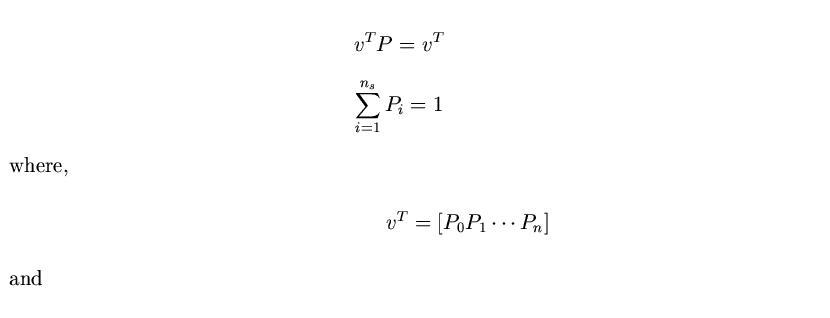
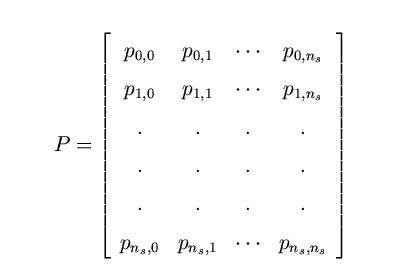
P is a stochastic matrix i.e. all the entries are non-negative and the sum of all the
entries in a row is unity. After calculating conditional probabilities and steady state
probabilities, we can get the total transition probabilities  as:
as:
Transformation to a Weighted Graph
Once the total transition probabilities have been calculated, the STG is transformed
into a weighted graph that can be used by the partitioner to give power optimized
realization.
The transformation of the STG into weighted graph can be done as follows:
1] Calculate the steady state probability vector and total transition probability as
explained above.
2] Remove all self loops as they are not required by the decomposition algorithm.
3] Collapse all multiple directed edges between two states and label the new edge
with the weight equal to sum of all the directed edges between those states.
The STG thus obtained is a weighted undirected graph with the total transition
probabilities as the weight on the edges. Following figure shows an example of conversion of a
STG to an undirected graph. The edge labels represent the input congurations that
will cause a transition between the states connected through that edge. For example,
in state S1, an input of 00,10 or 11 will cause the FSM to transit from state S1 to
S2.
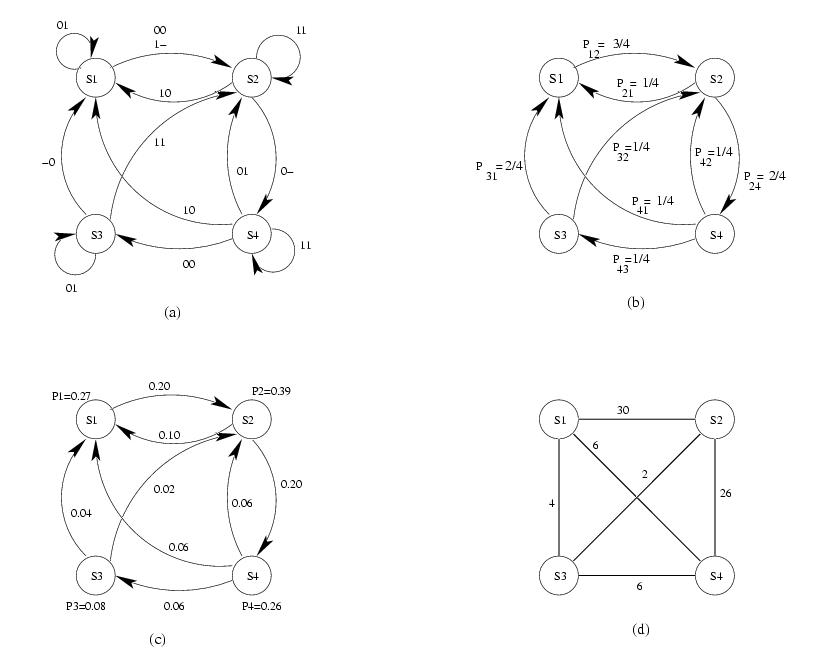
For obtaining the undirected graph, we assume that the inputs are uncorrelated
and equiprobable. Then conditional probabilities can be calculated as explained above.
Fig (b) shows the conditional transition probabilities for all edges. Fig (c)
shows the steady state probabilities for each state and the total transition probability
obtained by multiplying the conditional transition probability with the steady state
probability of the state at it's tail end. Fig (d) obtains the undirected graph by
merging all the parallel edges and adding up their transition probabilities.