|
Sr. No. |
Name (*.wav) |
Pitch contour before and after smoothing |
| 1 | flute | 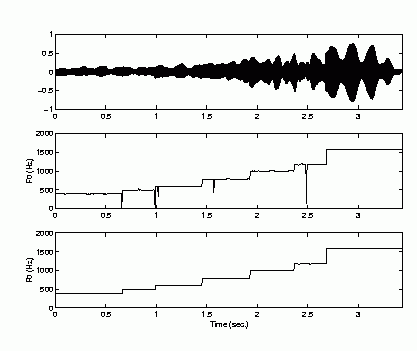 |
| 2 | clarinet |  |
| 3 | saxophone | 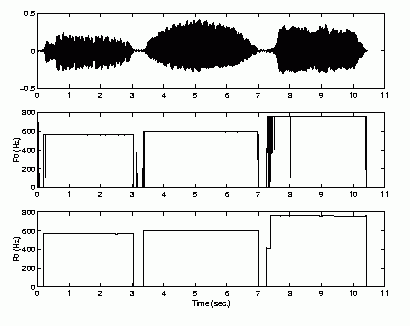 |
| 4 | trumpet |  |
| 5 | flute1 | 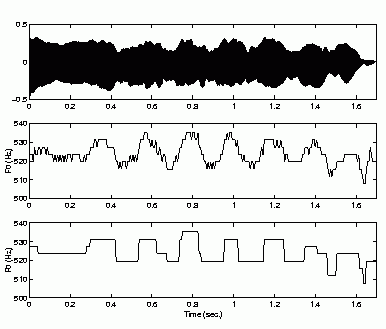 |
Spectrum Interpolation Synthesis for the Compression of Musical Signals
This demonstration accompanies the MTech. dissertation by Ashish Kumar Malot under the guidance of Prof. Preeti Rao and Prof. V.M.Gadre. The title and abstract of the thesis are given below followed by the results.
| Title: MPEG4 Structured Audio: A Compression Model for Harmonic Musical Sounds |
| Abstract |
| In our study we have investigated algorithmic sound models for low bit rate coding of musical signals. We have presented a technique for completely automatic analysis/synthesis of harmonic signals. The technique uses the spectral interpolation synthesis (SIS) model for harmonic signals. The parameters needed for sound synthesis using the SIS model are the fundamental frequency and the amplitude spectrum of each pitch period. We have presented effective methods for automatic pitch extraction, spectrum estimation and synthesis of harmonic musical signals. A pitch-adaptive frequency domain estimation procedure is applied to the input music signal to extract the pitch contour and the harmonic spectrum amplitudes for each period. An algorithm for the smoothing of the pitch contour to eliminate coarse errors arising at note transitions has been proposed. A modified error criterion has been proposed for the selection of spectra for synthesis. The signal is synthesized on a period by period basis by adjusting the phases of the contributing harmonics to ensure continuity and absence of audible artifacts across pitch transitions. The technique has been applied on several examples of segments from wind and bowed string instruments. It is found that typically a perceived quality matching the original is obtained even when large portions of the waveform are generated by interpolation, implying a high degree of compression. Further, there is a graceful degradation in quality as the extent of interpolation is increased which makes the model well suited for use in a scalable coding framework. |
Performance of Pitch Contour Smoothing
|
Sr. No. |
Name (*.wav) |
Pitch contour before and after smoothing |
| 1 | flute | |
| 2 | clarinet | |
| 3 | saxophone | |
| 4 | trumpet | |
| 5 | flute1 | |
Performance of SIS in Scalable Framework
BL stands for the base layer.
EL stands for the enhancement layer.
R is the ratio of chosen spectra to the total number of spectra expressed in percentage.
SNR is the segmental-SNR computed with respect to the waveform synthesized by using
all the spectra.
| Sr. No. | Name (*.wav) | Layer | R (%) | SNR (dB) | Synthesized waveform (*.wav) |
| 1 | flute | BL+EL1+EL2
BL+EL1 BL |
10.96
7.80 4.64 |
28.61
24.44 20.37 |
s_flutebpe12 |
| 2 | clarinet | BL+EL1+EL2
BL+EL1 BL |
1.98
1.46 0.95 |
34.14
31.39 28.75 |
s_clarinetbpe12 |
| 3 | saxophone | BL+EL1+EL2
BL+EL1 BL |
6.29
4.29 2.28 |
29.26
25.49 21.81 |
s_saxophonebpe12 |
| 4 | trumpet | BL+EL1+EL2
BL+EL1 BL |
15.64
11.00 6.37 |
27.59
23.96 19.90 |
s_trumpetbpe12 |
| 5 | flute1 | BL+EL1+EL2
BL+EL1 BL |
17.47
12.51 7.55 |
29.66
24.59 19.11 |
s_flute1bpe12 |